Widgets for you and the entire team
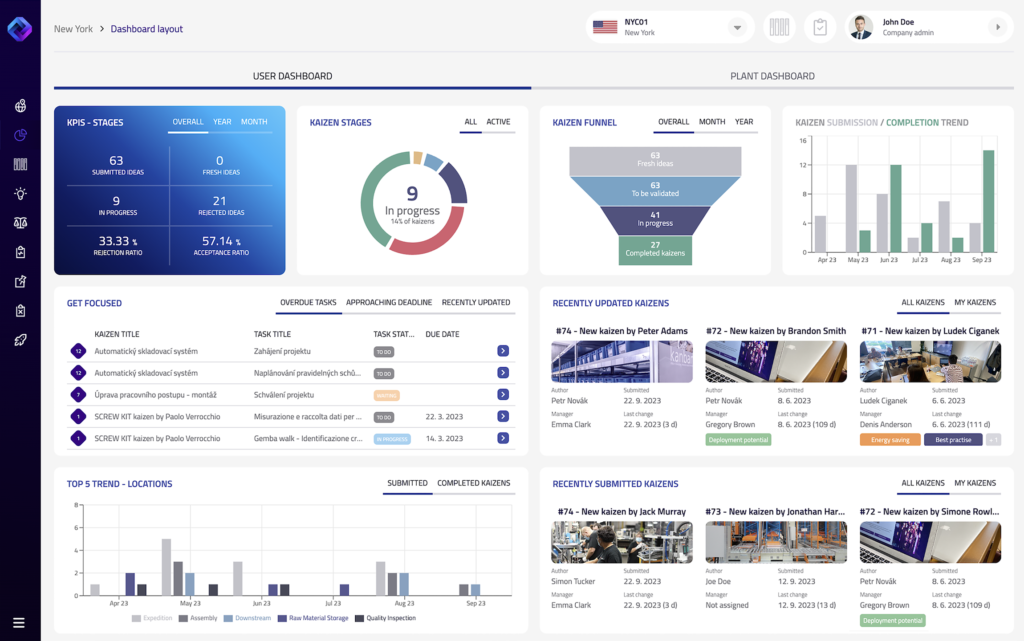
Widgets are your dashboard’s best friends. They’re the first things you see when you log in. We get it – everyone on your team needs to be on the same page, but you also want data tailored to your role. That’s why you can customize widgets at two levels: for your plant and for you as a user.

Design your own dashboard
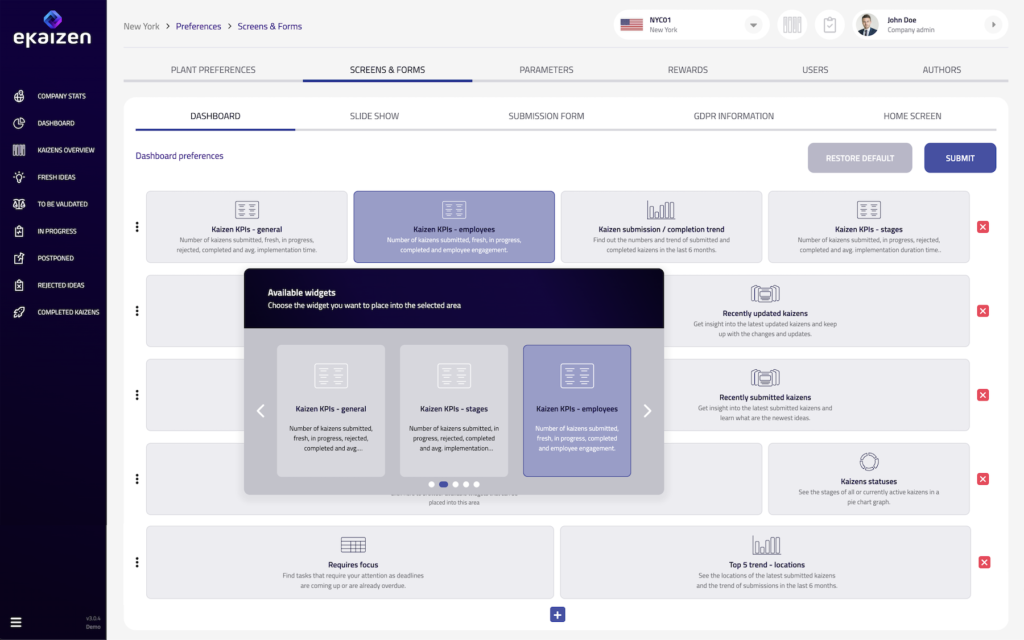
No matter what your role is, eKaizen’s reporting system is designed to accommodate the needs of various stakeholders. Our Dashboard Designer feature makes customization easy. Your dashboard will be uniquely yours. You can access over 30 different sets of information presented through graphs and reports, giving you the flexibility to make the most of the data available to you.

Regional & corporate statistics
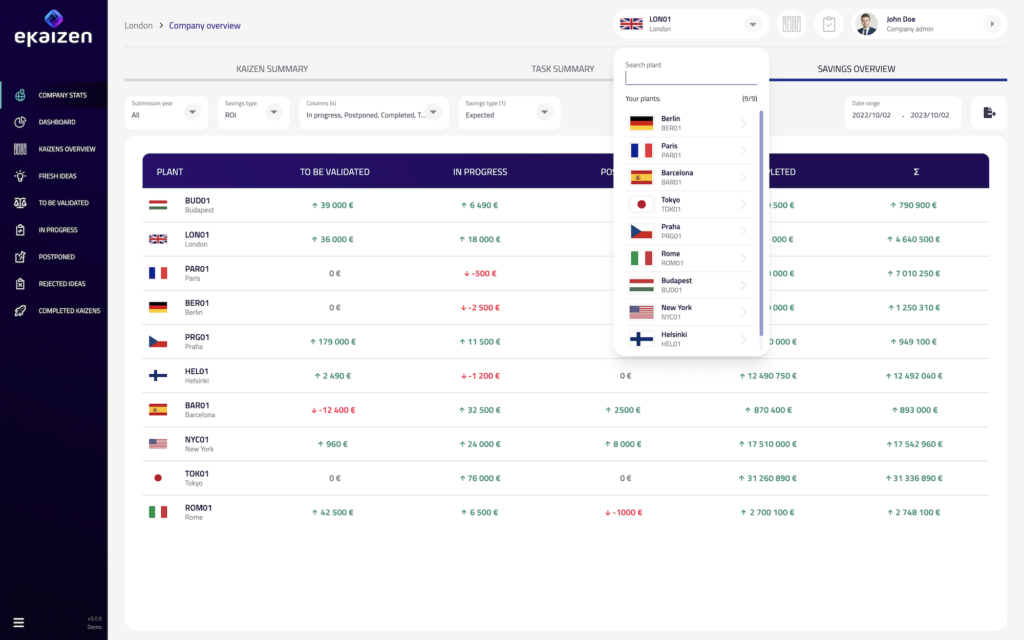
Are you responsible for several plants in your region – or do you have a corporate role? You can easily monitor and compare the performance of all locations by accessing company statistics. Stay informed about the number of projects in all stages, savings and more.

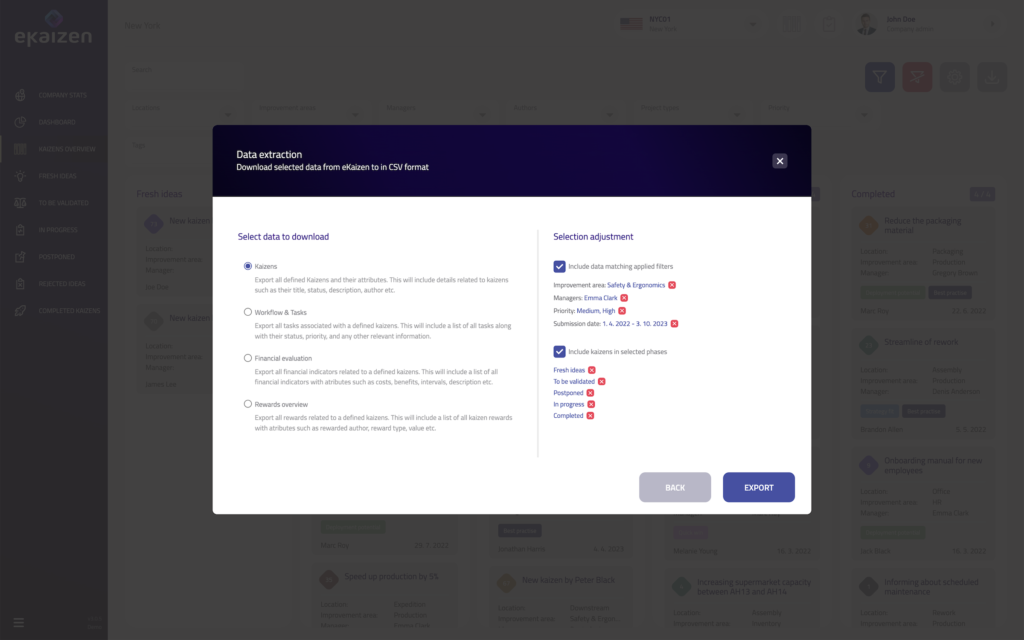
Export data if you need to
Sometimes you need to take eKaizen data elsewhere, like PowerBI, Excel or another 3rd party application. You can easily export the data as a CSV file. And guess what? You can automate it too. Schedule automatic exports via API, and we’ll deliver them to you like clockwork.


